Nega-Posi Battery Bidding in Japan

Introduction
Japan’s grid operators pay batteries to stand ready to correct frequency deviations within seconds. This service, the primary frequency control reserve (FCR), is contracted in 30-minute slots on the balancing market run by the Electric Power Reserve eXchange (EPRX): the battery offers a response capacity in kW (ΔkW) and is paid a capacity price for it, whether or not a frequency deviation happens.
What matters for frequency is the balance between supply and demand: when frequency drops,1 a battery doing FCR can either discharge more, adding supply, or charge less, removing demand. The grid sees the same effect either way, but the market measures the response against the battery’s registered schedule. Posi-only operation offers only extra discharge, capped by the battery’s discharge rating. Nega-posi operation also counts the reduction of scheduled charging: a battery charging at full power can stop charging and start discharging, so its bid can reach twice its rating.
Despite the benefits, nega-posi operation comes with technical and operational hurdles that make it hard to execute at scale, so many participants in the balancing market bid discharge only. The purpose of this article is to quantify the revenue that this leaves unrealised. We measured the value of nega-posi on real market data from April 2025 to August 2026, in two steps: first from the prices alone, the FCR capacity price and the day-ahead spot price; then by simulating the dispatch of three representative assets over the same period, once posi-only and once nega-posi, on the same data. In both modes, FCR earned the batteries far more than trading on the spot market alone. The answer is consistent across the four grid areas studied: nega-posi earns 1.3–1.8 times the FCR revenue of posi-only over the whole period, depending on the asset and grid area, and up to 2.2 times in the 2026 months.
The main results:
- Over the full period nega-posi earned up to 1.8× the FCR revenue of posi-only; no asset in any of the four grid areas gained less than 1.3×.
- In the new day-ahead balancing market (April to August 2026) the advantage reached 2.2×. For the standalone battery the cheaper market itself widens the gap: over the same five months a year apart, its uplift rose from 1.29× to 1.52×.
- The gain comes from two effects that multiply: the battery stays in FCR while it refills, and while charging it can bid up to twice its discharge rating.
The economics of nega-posi
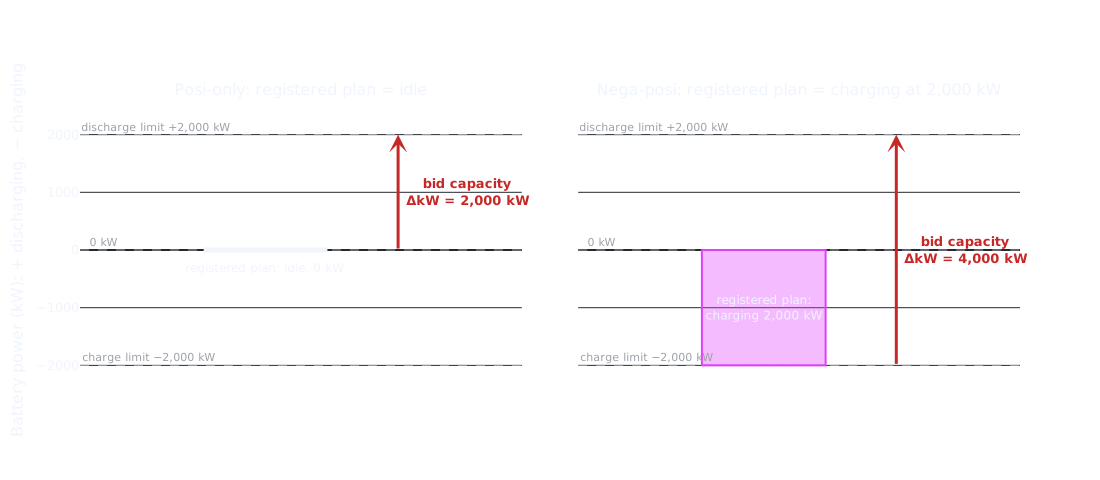
Figure 1 shows the mechanism for a 2 MW battery, adapted from [3, p. 18]. The balancing market pays for the distance between the battery’s registered plan and its discharge limit. An idle battery can move from 0 to +2,000 kW: ΔkW = 2,000 kW. A battery whose plan is to charge at full power sits at −2,000 kW and can move to +2,000 kW: ΔkW = 4,000 kW. The charging itself is what creates the extra 2,000 kW of bid capacity.
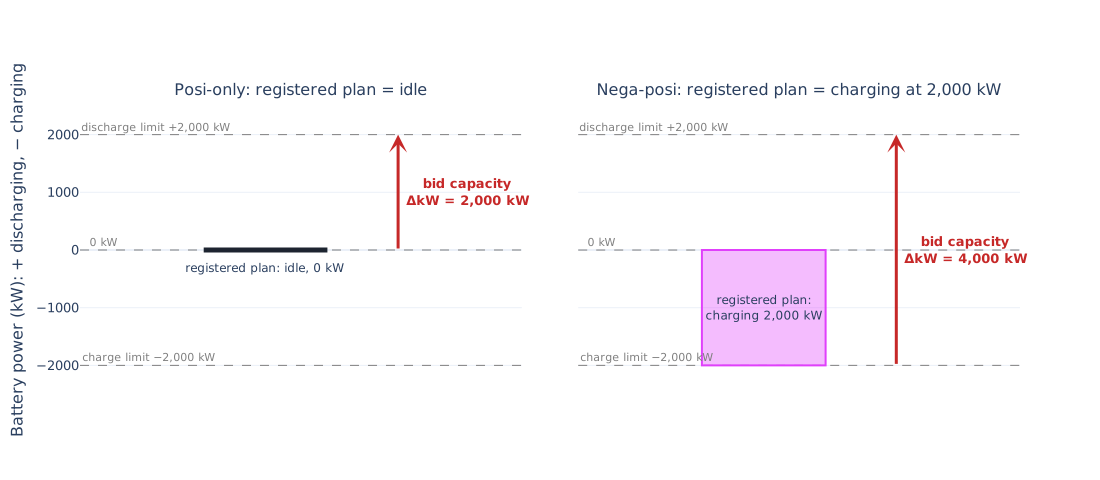
Suppose the battery charges E kWh during one committed slot. Under nega-posi, the 2E kW of charging power behind it are added to the bid and paid at the capacity price. The energy itself is not an extra cost, because a posi-only battery buys the same energy anyway, only in a different slot outside FCR. The true extra cost is the price difference between charging now and charging at the day’s cheapest hour. Putting the two together gives a measure of our own, the nega-posi margin:
nega-posi margin = 2 × capacity price − (spot price − cheapest spot price of the day) (¥ per kWh charged)
It says what one kWh of charging earns on top of the FCR revenue the battery already makes. A negative margin means the slot is too expensive to charge in, and the battery is better off refilling elsewhere, as a posi-only battery would.
Averaged over all slots, with negative values counted as zero, the margin was ¥22–31 per kWh charged in FY2025, positive in 67–92% of slots (Table 1). Nega-posi cycles more energy through the battery than posi-only. If we assume a cycle cost of ¥10 per kWh of throughput for battery wear, the margin comfortably covers it. In the cheaper 2026 market the margin fell to ¥7–16, still positive in 65–96% of slots depending on the grid area (Table 1, Figure 2).
| Grid area | Full period: margin | positive | FY2025: margin | positive | Apr–Aug 2026: margin | positive |
|---|---|---|---|---|---|---|
| Tokyo | ¥21.7 | 93% | ¥24.1 | 91% | ¥15.7 | 96% |
| Chubu | ¥20.3 | 73% | ¥22.5 | 67% | ¥14.8 | 88% |
| Chugoku | ¥20.1 | 71% | ¥24.4 | 73% | ¥9.3 | 66% |
| Kyushu | ¥24.0 | 84% | ¥30.6 | 92% | ¥7.5 | 65% |
Table 1. The nega-posi margin per grid area: mean over all slots in ¥ per kWh charged, negative values counted as zero, and the share of slots with a positive margin. Full period = April 2025 to August 2026.
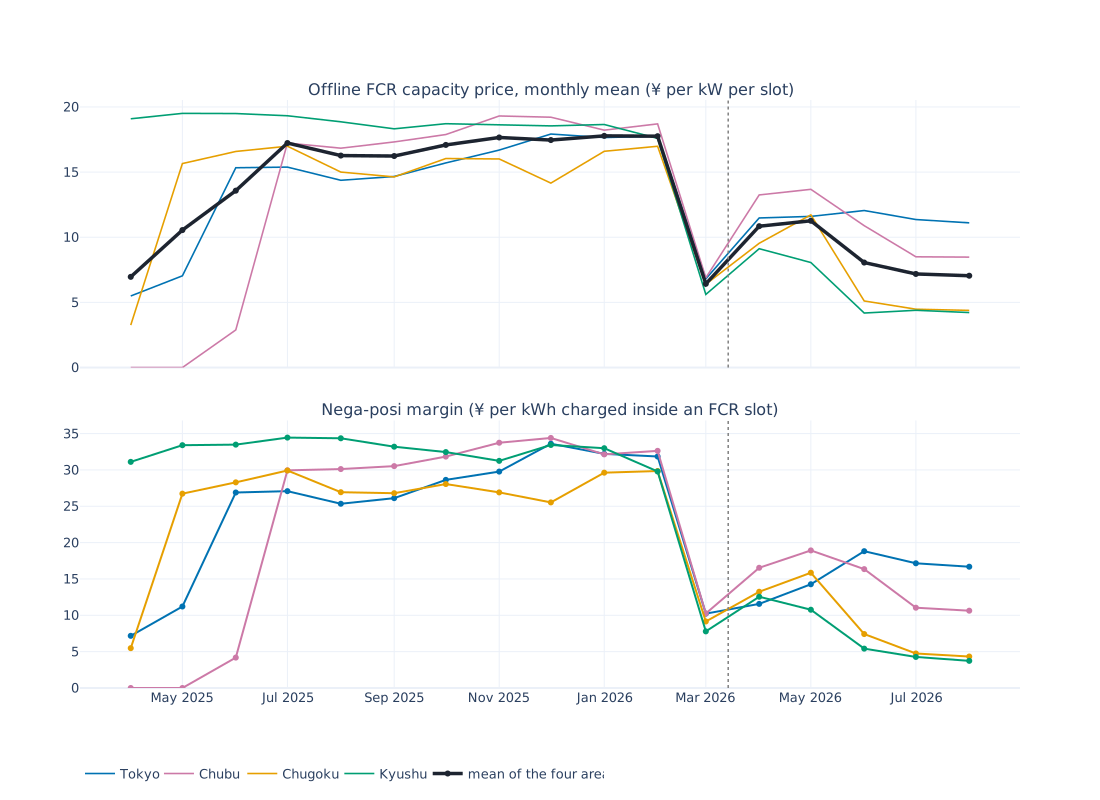
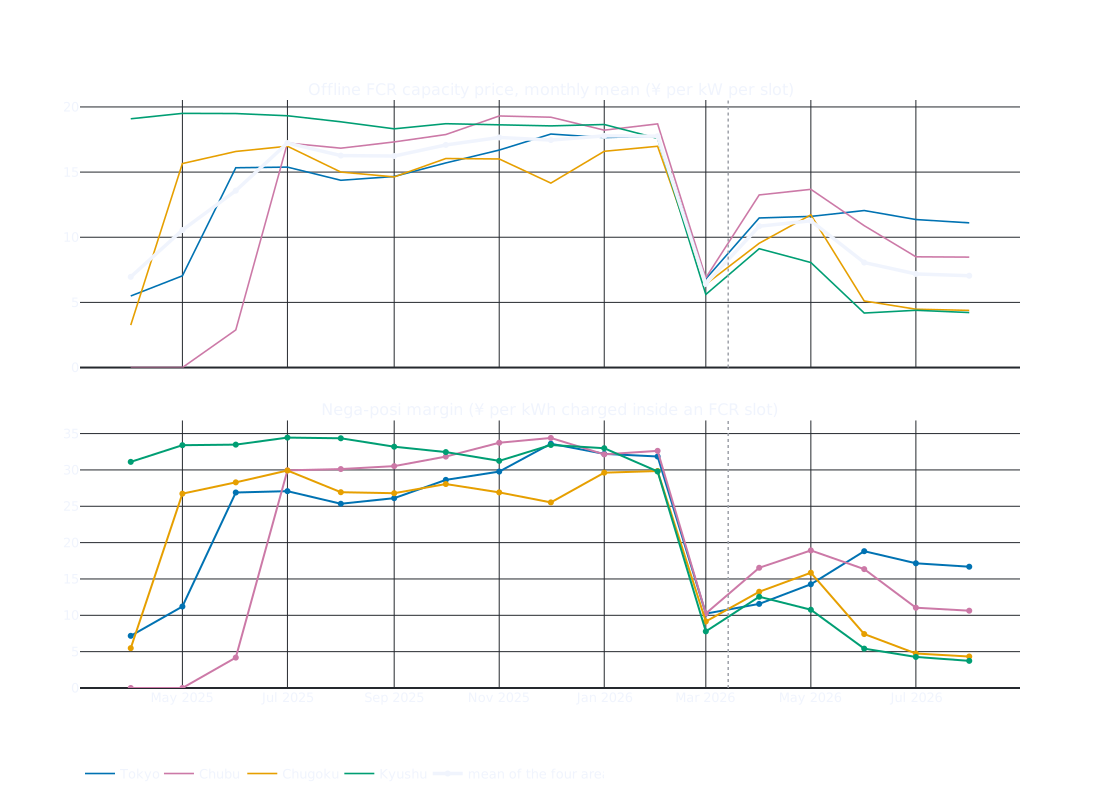
The extra revenue follows the capacity price, so it was highest in FY2025. The relative advantage over posi-only, however, moves inversely with the price. A posi-only battery must leave FCR to refill, and it accepts that sacrifice only while FCR pays well; when prices fall it bids less and less, while nega-posi keeps charging inside FCR at any positive margin. So, for a battery without solar, the cheaper FCR gets, the bigger nega-posi’s relative advantage, and the smaller the amounts at stake.
Simulation setup and assumptions
Three assets were run through our dispatch engine at 30-minute resolution, continuously from April 2025 to late August 2026, each in two modes: posi-only, with bids capped at the battery’s discharge rating, and nega-posi, with charging capacity counting toward the bid. Each asset was also run trading on the spot market only. Those results are not shown, as spot trading is not the subject of this article, but both FCR modes out-earned it in every grid area. Results are reported over the full window. We distinguish the periods FY2025 (April 2025 to March 2026, mostly under the old weekly market) and April to August 2026 (the new day-ahead balancing market), as we consider the difference relevant.
| Asset | Voltage | Battery | Solar array | Site meter capacity | Coupling |
|---|---|---|---|---|---|
| Standalone battery | HV | 2,000 kW / 8,000 kWh | — | 2,000 kW | AC |
| HV solar+battery | HV | 2,000 kW / 4,300 kWh | 2,380 kW DC | 1,990 kW | AC |
| LV solar+battery | LV | 49.75 kW / 216 kWh | 25 kW DC | 49.5 kW | AC |
Table 2. The three assets. HV = high voltage, LV = low voltage; solar arrays are rated in DC kW. Site capacity is the connection limit at the meter.
All market inputs are historical data [9–12]:
- the offline FCR contracted prices per grid area and 30-minute slot;
- day-ahead area prices from the JEPX wholesale exchange;
- the share of each grid area’s solar output that was curtailed in each slot;
- hourly weather at each site.
Grid charging is enabled for every asset in both modes, since nega-posi requires it.
Dispatch decisions are produced by a single rule-based policy shared by both modes. At each 30-minute slot the dispatcher evaluates the battery’s energy against a 12-hour horizon — FCR capacity revenue, spot sales and purchases, and a wear cost of ¥10 per kWh cycled, all evaluated on the realised prices and solar output of those hours — and schedules charging in low-priced hours that do not conflict with a prospective FCR commitment. Posi-only operation cannot charge and hold a commitment in the same slot, so refills are placed in hours where FCR clears near zero even when marginally cheaper energy is available; nega-posi operation charges inside its commitments. All remaining rules are common to both modes, so divergences between them largely reflect the bid definition. The dispatch rules are simplified rather than optimal. Timing refills and sales on the spot price alone costs nega-posi little, but may cost posi-only commitments it could have kept. The posi-only baseline is therefore conservative, and the reported uplifts are a rough upper bound. However, no posi-only rule can charge and hold a commitment at the same time, and no posi-only bid can exceed the discharge rating. Even smarter rules would narrow the gap, not close it.
Every bid is assumed accepted at the slot’s average contracted price; absolute revenue figures are only illustrative, and the focus is on the ratios, which assume the market absorbs the larger nega-posi bids at the same rate as posi-only bids. Imbalance settlement of the response energy is left out. The co-located plants offer no FCR during solar hours. Holding an FCR commitment costs energy, 0.0525 kWh per kW of rating per committed slot, and a committed battery may bid regardless of its stored energy, provided it can supply each slot’s response energy.
Results per grid area
Results are reported for Tokyo, Chubu, Chugoku and Kyushu, the four grid areas whose offline FCR market cleared above zero in at least two thirds of FY2025 slots (67–93%).2
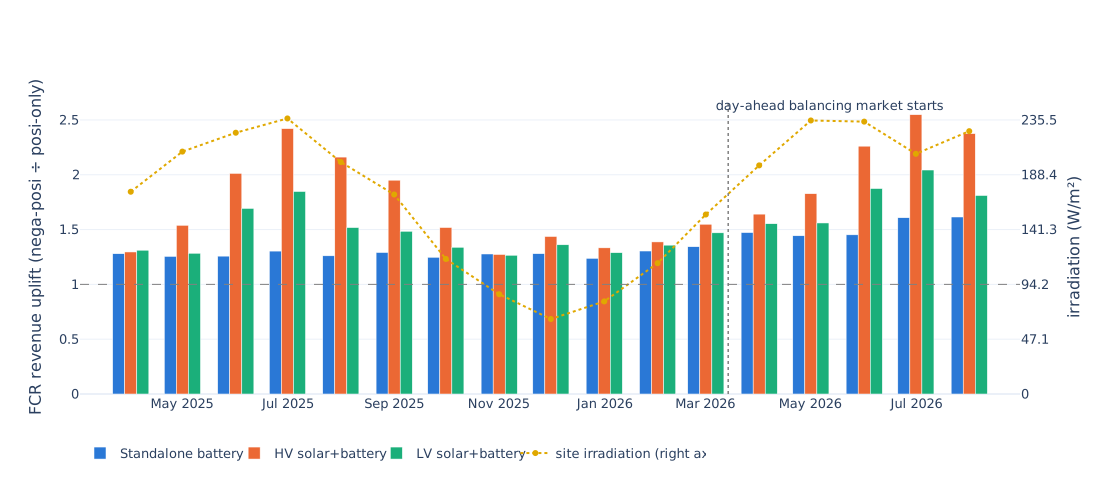
| Standalone battery | HV solar+battery | LV solar+battery | ||||||||||
|---|---|---|---|---|---|---|---|---|---|---|---|---|
| Grid area | particip. | slots | bid | revenue | particip. | slots | bid | revenue | particip. | slots | bid | revenue |
| Tokyo | 80 → 93% | 1.16× | 1.13× | 1.31× | 28 → 41% | 1.47× | 1.22× | 1.78× | 35 → 44% | 1.25× | 1.22× | 1.52× |
| Chubu | 63 → 74% | 1.17× | 1.13× | 1.30× | 24 → 33% | 1.37× | 1.21× | 1.62× | 28 → 35% | 1.23× | 1.22× | 1.48× |
| Chugoku | 61 → 73% | 1.19× | 1.14× | 1.32× | 23 → 29% | 1.27× | 1.23× | 1.50× | 27 → 32% | 1.16× | 1.23× | 1.38× |
| Kyushu | 74 → 89% | 1.21× | 1.13× | 1.33× | 29 → 40% | 1.39× | 1.18× | 1.58× | 34 → 42% | 1.24× | 1.19× | 1.43× |
Table 3. Participation and decomposition of the FCR revenue uplift per grid area, April 2025 to August 2026. Particip. is the share of slots with an FCR commitment, posi-only → nega-posi; the three ratios (nega-posi ÷ posi-only) are the growth in committed slots, the growth in the average bid, and the revenue uplift.
The uplift has two drivers (Figure 3). The first driver is the seasonal solar cycle: irradiation at the co-located sites roughly triples from winter to summer (yellow line in the same figure). After the evening sale the posi-only plant is empty precisely through the best-paid evening slots, and it stays out of FCR until it refills after midnight; in summer it holds about one slot in five. Nega-posi commits through those same evenings, charging inside its commitments, so the gap peaks every summer. The second driver is the market change of March 2026: day-ahead trading, far more competition and the price cap cut from ¥19.51 [5] to ¥15 [7]. Its effect shows cleanly in the standalone battery, which has no season: over the same five months, April to August, a year apart its uplift rose from 1.29× to 1.52×, because a cheap market makes dedicated refills harder to justify.
Standalone battery. A standalone battery does well even posi-only, because it rarely has to leave FCR to refill. Each committed slot drains about 105 kWh from a 2 MW battery, while one slot of full-power charging from the grid puts back up to 1,000 kWh. One refill slot therefore covers roughly ten committed slots, and the battery can pick a cheap hour for it. That is why posi-only already holds FCR in 61–80% of slots (Table 3). Nega-posi improves on this in two ways: the refill slots themselves stay in FCR, so charging no longer costs a slot, and while charging the bid grows beyond the discharge rating. The two effects multiply; in Tokyo, 1.16× as many committed slots and bids 1.13× as large roughly give the 1.31× observed (Table 3).
HV solar+battery. The co-located plant starts from a weaker posi-only position. Since slots with solar output are not used for FCR, the evening goes to selling the energy stored during the day, and the refills, from its own solar at midday or from the grid at night, both happen outside FCR. Posi-only participation is 23–29% of slots (Table 3). Nega-posi keeps bidding through the night refills and makes those bids larger, lifting participation to 29–41% and FCR revenue to 1.50–1.78×. The gap is larger than the standalone battery’s because the posi-only baseline is weaker: only the dark, priced hours are usable at all. After the evening sale the plant is empty through exactly those hours, while nega-posi commits through them as it charges.
LV solar+battery. The 49.5 kW unit tells the same story at one-fortieth scale: posi-only it holds FCR in 27–35% of slots, nega-posi in 32–44% (Table 3), and it earns 1.38–1.52× the FCR revenue. A unit this small cannot enter the market on its own; it joins through an aggregator that pools enough units to reach the market’s 1 MW minimum. The numbers here are for one unit, before the aggregator takes its share.
Table 4 completes the per-segment picture over the same period. Average bid is the ΔkW offered in the slots where the asset bids. Since posi-only cannot exceed the discharge rating and nega-posi can, in single slots the bid reaches nearly twice the rating (3,790 kW for the standalone battery, 94 kW for the LV unit’s 49.75 kW battery), a battery charging at nearly full power while committed. Battery revenue adds the result of day-ahead trading to the FCR revenue. Its uplift sits slightly below the FCR uplift, because nega-posi refills inside its commitments in slightly more expensive hours than posi-only would pick, and loses a little trading revenue.3
| Segment | Participation posi → nega-posi | Average bid posi → nega-posi | FCR revenue, mean of 3 areas, posi → nega-posi | FCR revenue uplift | Battery revenue uplift |
|---|---|---|---|---|---|
| Standalone battery | 68% → 82% | 2,000 → 2,265 kW (+13%) | ¥559M → ¥734M | 1.31× | 1.29× |
| HV solar+battery | 26% → 36% | 2,000 → 2,421 kW (+21%) | ¥214M → ¥353M | 1.60× | 1.56× |
| LV solar+battery | 31% → 38% | 49.75 → 61 kW (+22%) | ¥6.3M → ¥9.3M | 1.45× | 1.42× |
Table 4. Summary per segment, April 2025 to August 2026. Participation, bids and uplifts are medians of the four grid areas. FCR revenue is the mean of Tokyo, Chubu and Kyushu; Chugoku is left out because a 2 MW asset dominates its small market, and the ratio implied by the revenue pair therefore differs slightly from the uplift column. Revenue is before the acceptance caveat of the simulation setup section.
Dispatch case study
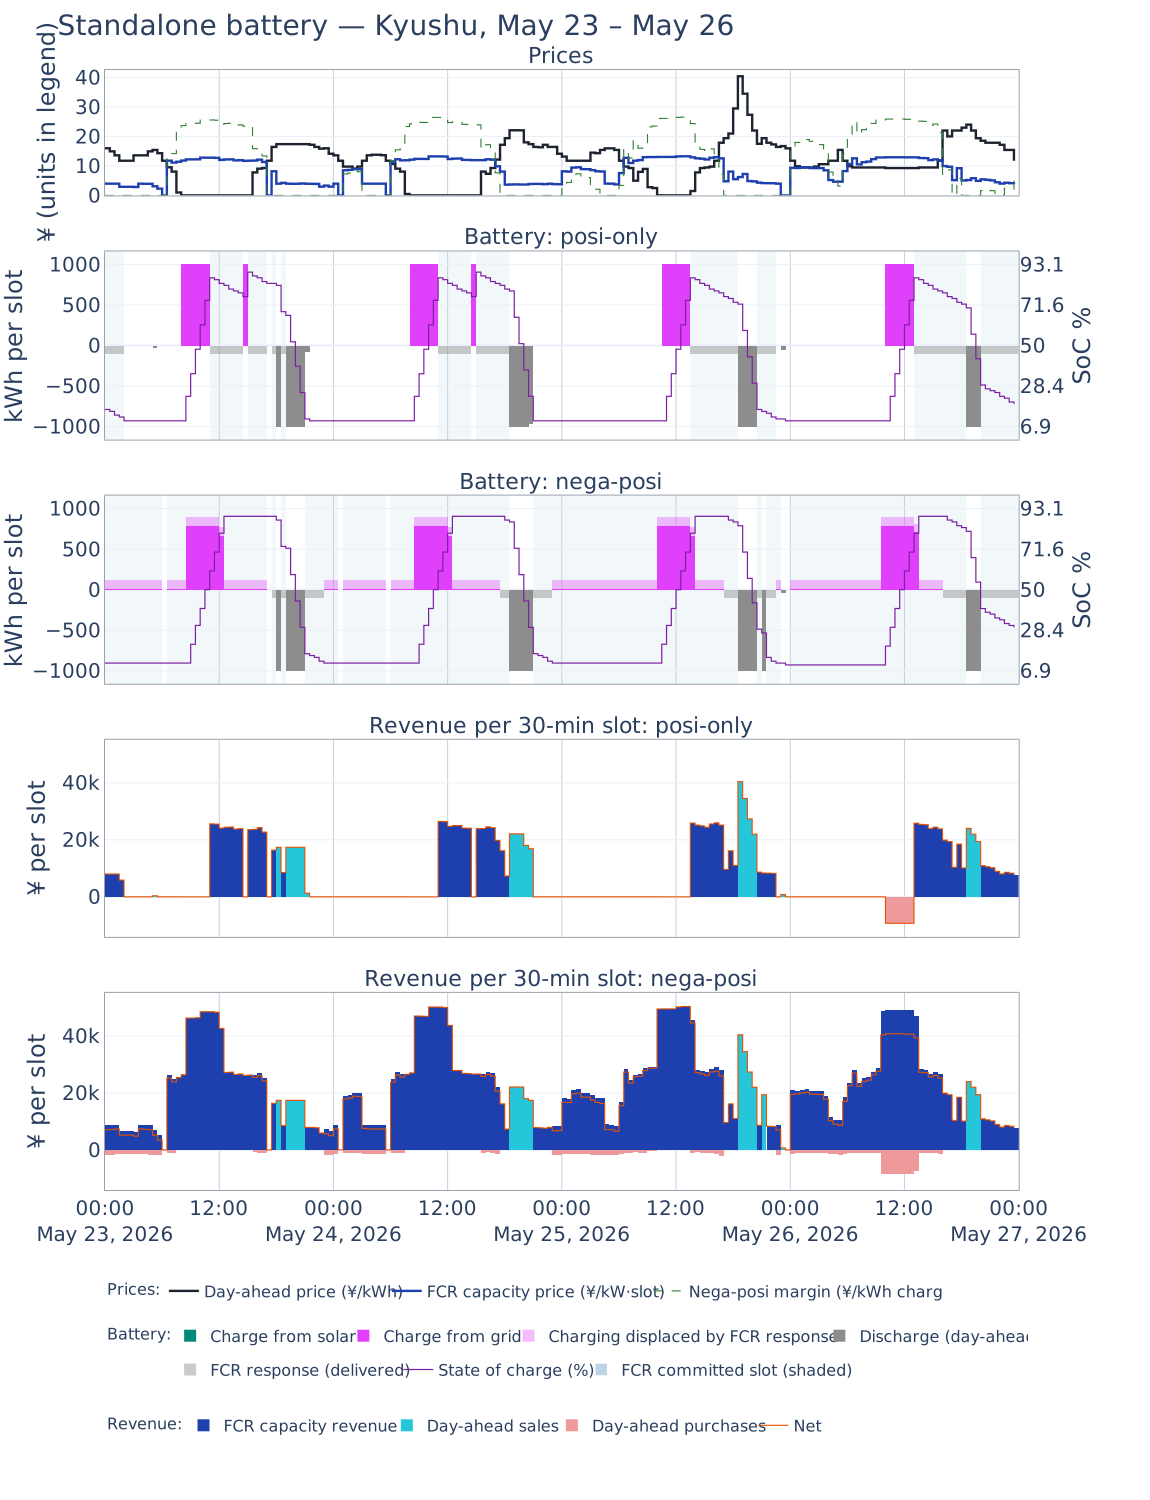
For the standalone battery we chose one 4-day window as a case study. The top panel shows the day-ahead spot price, the FCR capacity price and, dashed, the nega-posi margin of each slot, with negative values counted as zero. The two battery panels show charging above the line and discharging below, the state of charge on the right axis, and committed FCR slots shaded. In nega-posi committed slots the battery responds by charging less than scheduled: the pale cap on a charge bar marks the displaced charging, and only the solid part reached the battery; pale gray below the line marks response delivered as discharge. The small charge bars along the zero line inside shaded hours show that overnight, nega-posi often holds commitments at the state-of-charge floor, charging little more than each slot’s response energy. The two revenue panels show each slot’s capacity revenue plus day-ahead sales minus purchases.
Standalone battery, Kyushu, May 23–26, 2026. (Figure 4.) Midday solar surpluses make Kyushu’s cheapest hours fall around noon, and both modes charge through them and discharge into the evening. The main difference happens at night: after the evening sale, posi-only waits uncommitted at the state-of-charge floor for the next cheap midday, holding 64 of 192 slots.4 Nega-posi holds FCR through those same hours at the floor, charging little more than each slot’s response energy on bids above 2,000 kW. Over the window, FCR revenue is ¥4.0M for nega-posi against ¥1.2M for posi-only.
Conclusions
In every grid area and month with a market, nega-posi out-earned posi-only in our simulations. Over the full period the standalone battery earned 31% more FCR revenue, the HV solar+battery plant 60% more and the LV unit 45% more. The gain comes from the same two effects throughout: the battery stays in FCR while it refills, and while charging it can bid up to twice its discharge rating.
The value per kWh can be read from the prices alone: the nega-posi margin averaged ¥22–31 per kWh charged in FY2025 and ¥7–16 in 2026, and the revenue nega-posi adds scales with it. The ratio against posi-only depends on how the battery is dispatched, so it comes from the simulation rather than from the prices alone. The ratio increased for all three assets as the market became cheaper; the standalone battery, which has no seasonal component, isolates the market effect most clearly, rising from 1.29× to 1.52× over the same months one year apart. If capacity prices stay low, as the ¥10 cap in force from 1 September 2026 [8, 6] suggests, nega-posi’s advantage should keep growing.
References
- Electric Power Reserve eXchange (EPRX), 取引規程(需給調整市場) [Trading Rules of the Balancing Market], ver. 18.
- EPRX, 取引ガイド(全商品) [Trading Guide of the Balancing Market, all products], ver. 10.
- EPRX, 需給調整市場かいせつ資料 [Overview of the Balancing Market], explanatory document.
- EPRX, 揚水発電設備または蓄電池設備を用いて需給調整市場に参入する場合の取扱いガイド [Market Participation Guide for Pumped Storage and Batteries], ver. 3.
- EPRX, 需給調整市場のΔkW上限価格について [“Upper price limits for ΔkW contracts”], notice of Sep. 30, 2024.
- EPRX, 需給調整市場のΔkW上限価格について [“Upper price limits for ΔkW contracts”], notice of Jul. 30, 2026.
- Ministry of Economy, Trade and Industry (METI), 需給調整市場について [On the Balancing Market], 110th Working Group on Electricity Market Design, paper 4, Jan. 23, 2026.
- METI, 需給調整市場について [On the Balancing Market], 4th Working Group on Stable Power Supply, paper 6, Jul. 14, 2026.
- EPRX, published trade results, per grid area and 30-minute slot; edited into monthly and period aggregates.
- Japan Electric Power Exchange (JEPX), day-ahead area prices.
- Transmission system operators, published area supply and curtailment data.
- ECMWF ERA5 reanalysis weather, retrieved through the Open-Meteo archive.
Footnotes
-
At the time of writing, only upward frequency adjustment — raising the frequency back to its nominal value — is allowed in Japan’s balancing market. ↩
-
Throughout, uplift means revenue with nega-posi divided by revenue with posi-only, and participation means the share of all 30-minute slots in which the battery holds an FCR commitment, over April 2025 to August 2026 unless a narrower window is named. Ranges span the four grid areas; single figures are medians of the four. ↩
-
Nega-posi buys its charging energy in the hours where it holds an FCR commitment. Those hours are cheap, but not always the day’s cheapest, so it pays slightly more for the same energy, and while committed it occasionally passes up a profitable trade that posi-only would have made. Both effects trim the trading result while the FCR revenue grows. ↩
-
A night refill would buy energy at about ¥13 per kWh in this window, against about ¥3 at midday, and posi-only cannot charge and hold an FCR commitment in the same slot, so a refill slot earns no capacity revenue either; the dispatcher waits for the midday valley. ↩