The Japanese electricity sector in crisis: How data can help making sense of the current situation

 Japan is experiencing an acute electricity crisis: over the past 6 months, price levels and volatility on the day-ahead and intraday markets have been spiking, bankrupting major players, and sharply increasing cost for consumers.
In this report, we leverage our extensive repository of market and grid data to analyze the current situation across the Japanese electricity value chain, and identify the 3 major causes of the crisis.
What is happening in Japan’s electricity sector
When we conducted our in-depth analysis of the current situation in the Japanese electricity sector, three things stood out: very low reserve capacities, consistently high prices, and increasing price volatility on the JEPX day-ahead market.
This market disruption started in October 2021, but does not affect the whole country equally. All metrics are at their most extreme in the Tokyo region, with a substantially deflated reserve rate and extreme price spikes. Looking at the data reveals why Tokyo was particularly affected.
Dwindling reserve capacity
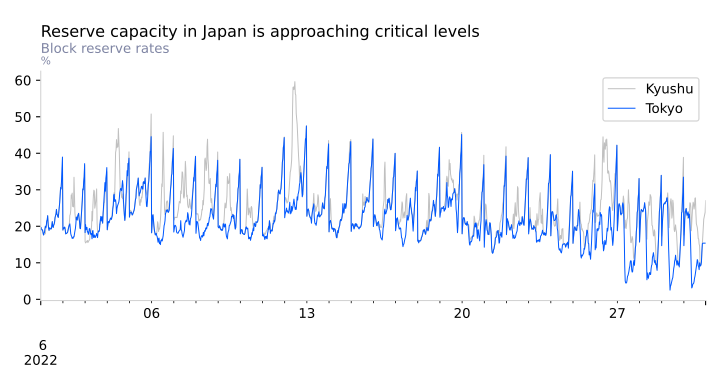
Reserve capacity is the amount of spare generation capacity available over what is used to meet electricity demand. This is an important metric, as reserves are needed to respond to unplanned events in the power grid such as sudden spikes in demand or an emergency shutdown of a large power plant or transmission line. When reserves are close to zero, the electricity grid is on the brink of collapse. In that situation, even minor deviations from expected electricity supply or demand can make costly demand-shaving measures necessary, or even lead to blackouts.
Out of all 10 electric utility zones in Japan, the TEPCO-managed Tokyo grid is the most affected. Its reserve rate dropped to as low as 2.5% at the end of June 2022, significantly increasing the chances of rolling or even unexpected blackouts.
Price spikes
Unexpected price spikes in the electricity market are a sign of weakness in the system, since they indicate that the most expensive - and often inefficient - power plants are needed to meet the demand. Price spikes also often inflict significant financial damage to electricity retailers, who have to rely on revenues from fixed-price contracts with electricity consumers, but are forced to buy at least part of their supply at the volatile day-ahead and intraday markets. This type of risk exposure from prolonged periods of high prices tends to bankrupt electricity retailers thus limits competition in the long term.
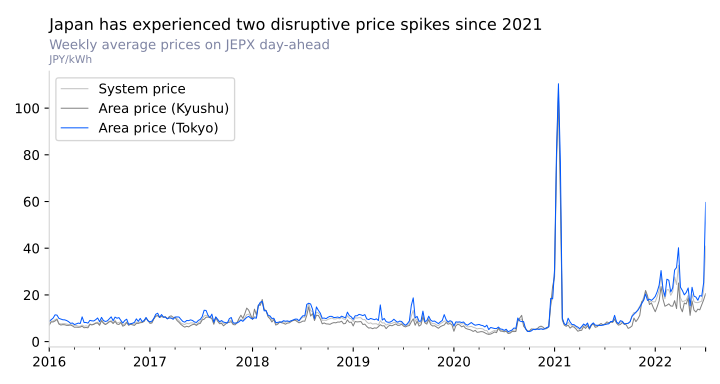
The last time the Japanese electricity system experienced a major price spike was at the end of 2020, when market prices suddenly increased by a factor of up to 10 and liquidity on the intraday markets dropped to zero, leaving retailers unable to cover their positions and exposing them to record-breaking imbalance charges.
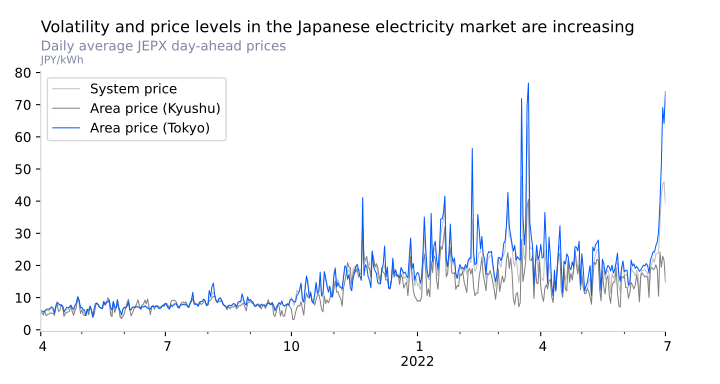
Since October 2021, Japan is now experiencing yet another type of price surge, with lower intensity but much longer duration and affecting different regions unequally. Over the past 8 months, daily average prices have been consistently 2-3 times higher than in previous years, with a consistent divergence of price levels between regions. Prices in Tokyo have been particularly high, while prices in Southwest Japan have stayed somewhat lower, although still at a multiple compared to previous years.
High volatility
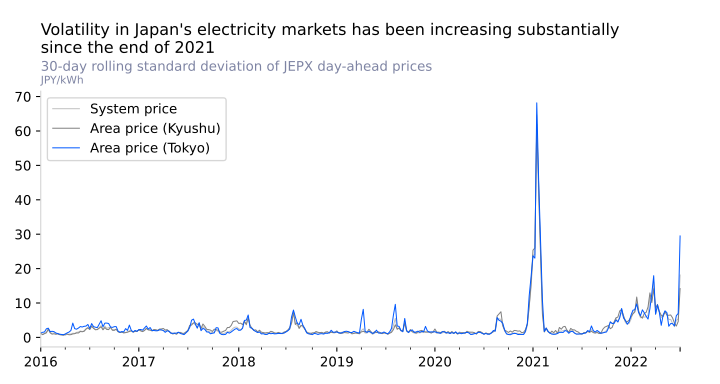
In line with an increase in price levels, volatility on JEPX day-ahead and intraday markets has also increased sharply since October 2021. While there have been periods of high volatility before (in particular, the spike in the winter of 2020-2021), the current increase has been longer-lasting than during any other period ever, leading to a new normal of high market volatility.
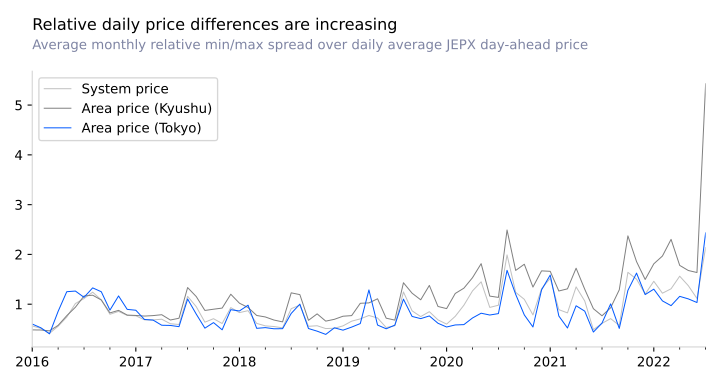
Volatility is also increasing in terms of difference between daily maximum and minimum prices, even when adjusting for the higher average daily price.
Causes of the current crisis
Analyzing market and grid data, we have identified 3 major structural causes of the current crisis:
-
Insufficient generation capacity
-
Bottlenecks in transmission capacity, especially at the 50/60hz interconnectors
-
Complex ongoing market reforms
All of these are excerbated by higher energy commodity prices and supply constraints due to the rebound from the Covid-19 pandemic, the Russian invasion of Ukraine, and an earthquake in March 2022 which caused unexpected power plant shutdowns.
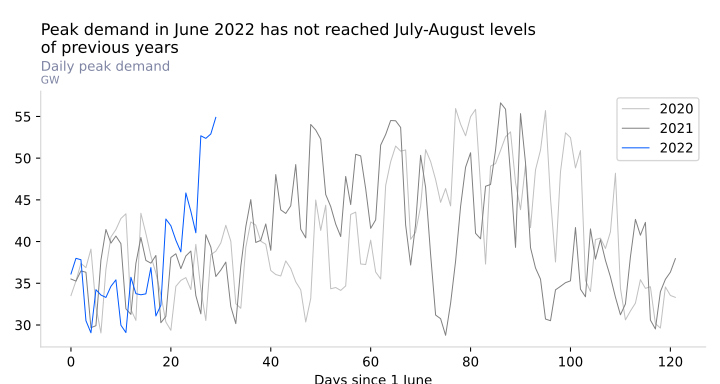
The data does not support increased electricity demand due to an unusually hot June as a root cause for electricity shortages however.
Insufficient generation capacity
The most important structural weakness of the Japanese electricity system is the lack of surplus generation capacity. This is mainly due to the almost complete shutdown of the nuclear fleet after the 2011 Tohoku earthquake and Fukushima accident. Before 2011, Japan relied on nuclear power for about 30% of its electricity consumption, with 54 operational nuclear reactors. As of June 2022, only 10 of the 54 reactors are back online. The missing nuclear generation has been replaced mostly by an increased reliance on existing fossil fuel power plants, namely coal, LNG, and oil. Most oil-fired power plants, however, have since been retired due to high operating cost and their inability to compete with low-cost solar electricity.
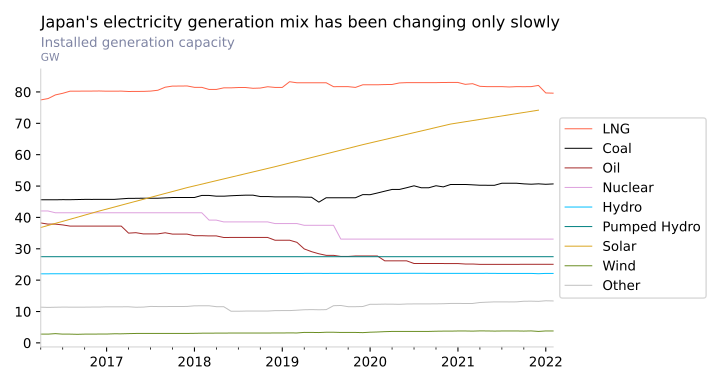
The increased generation from fossil fuels is mostly due to a higher utilization of existing plants. Solar photovoltaics is the only source of electricity showing a significant increase in net-new generation capacity. However, even at the current growth rate, the solar power capacity is still insufficient to replace the missing nuclear generation. About 40 GW of nuclear power capacity has been retired or put on long-term hold since 2011. Assuming a 90% capacity factor for nuclear power plants, and 15% for solar, Japan would need 240 GW of installed solar power just to compensate for the energy generation from the nuclear reactors taken offline.
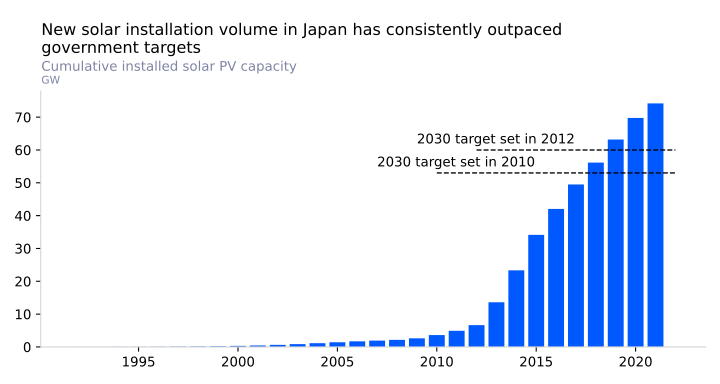
Over the last decade, Japan has installed a significant amount of solar PV, at over 70 GW. However, this is still far from what would be required to address the pressing structural weaknesses. In addition, at a capacity of 240 GW of solar power, there would need to be a long-term annual installation volume of 12 GW just to replace aging panels (assuming an average solar system lifetime of 20 years), compared to the roughly 5 GW installed in 2021.
That being said, new solar PV installation volume has still outpaced official Japan government targets: In 1809, the government was targeting 53 GW in 2030, a capacity that was promptly exceeded in 2018. The target was again raised in 2012 to 60 GW by 2030, which was again exceeded in 2019, only 7 years later and 11 years ahead of target.
Another challenge is the non-uniform distribution of power plants across Japan. Most of the non-operating nuclear reactors and missing conventional capacity are concentrated in the Northeastern regions, leading to bottlenecks in Japan’s notoriously fragmented and complex transmission grid.
Transmission constraints
One of the major causes of the current crisis is the structural lack of interconnection capacity between Northeast and Southwest Japan. The east-west transmission bottleneck is due to different grid frequencies between the two sides: Tokyo and Northeast Japan use 50 Herz, while West Japan operates its electricity grid at 60 Herz. This is a unique case in a country the size of Japan. For comparison, the entire continental Europe shares a single synchronized grid serving 400 million people and 24 countries, making it much easier to move electricity from where it’s generated to the place of consumption. This difference in frequency means that the two grids cannot be synchronized, and electricity can only be exchanged via expensive frequency converters. Until 2020, the total transmission capacity between the two grids was only 1.2 GW (less than 3% of the 40-50 GW of power required by the Kanto region alone), then upgraded to 2.1 GW in 2021.
Transmission capacity is especially important with an ever-increasing fleet of solar power plants that is mostly concentrated in the sunnier Southwestern regions, and which benefits from the ability to move electricity between the grid zones to average the variable production from the sun. Japan went from 3.6 GW of installed solar PV at the beginning of 2011 to 74 GW at the end of 2021, with a compound annual growth rate of over 30%. Japan has become the number 3 country globally by installed solar capacity after China and the United States. Solar PV now accounts for about 9% of electricity consumed, and is expected to grow at an increasing rate in the coming years.
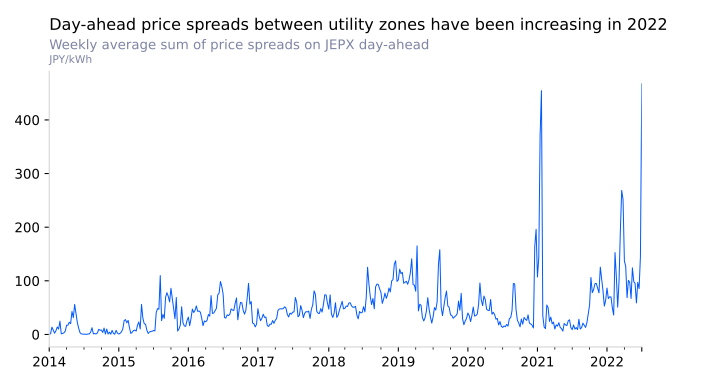
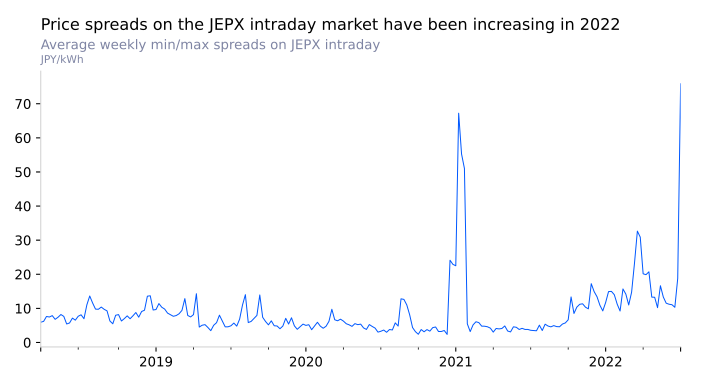
The lack of sufficient transmission capacity can be visualized by looking at the price deltas between utility grid zones. In the absence of transmission constraints, prices should be the same throughout Japan. The spikes in price deltas in the winter of 2020-2021 and in June 2022 however show that the supply challenges and high prices are at least in part due to transmission constraints. This can be seen also in the intraday contract price deltas, which are the difference between highest price and lowest price contracts during a given time period.
Market reform complexity
Another factor in the current crisis are the still incomplete electricity market reforms. Japan was slow to liberalize electricity markets. Europe started this process in the 1990s and early 2000s, and had the chance to refine its transition during a relatively calm period for the electricity grid. Japan started this process of liberalization in the middle of an energy crisis following the 2011 disaster, leading to unexpected consequences.
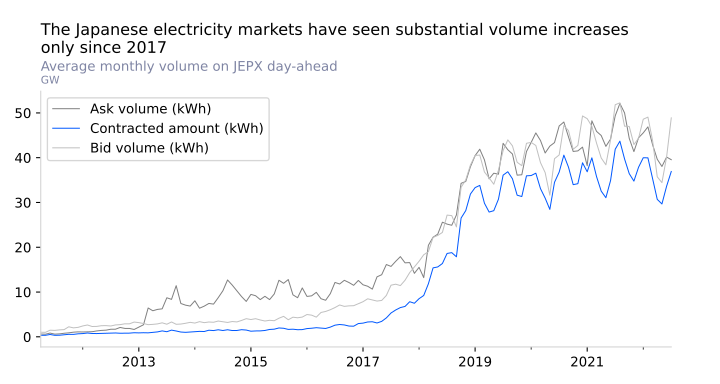
The establishment of the Japan Electric Power Exchange (JEPX) spot market for electricity was part of these market reforms. Starting from very low volumes in 2011, the spot market grew to account for a large proportion of the electricity supply, accounting for almost 50% of the average 110 GW of electricity supplied through the Japanese grid.
The market reforms broke the monopolies held by the big regional electric utilities and increased competition and efficiency. The efficiency increase was accomplished also by closing many old and inefficient power plants, which operated infrequently but provided backup power in times of need. The markets did not provide enough signals and incentives to keep backup power online. The use of price caps distorted the markets by blocking high price signals that would have spurred investment into backup power. The absence of adjustment mechanisms that proved effective in other markets, such as capacity payments, also exacerbated the problem. The capacity market in Japan is planned to be introduced only in 2024-2025.
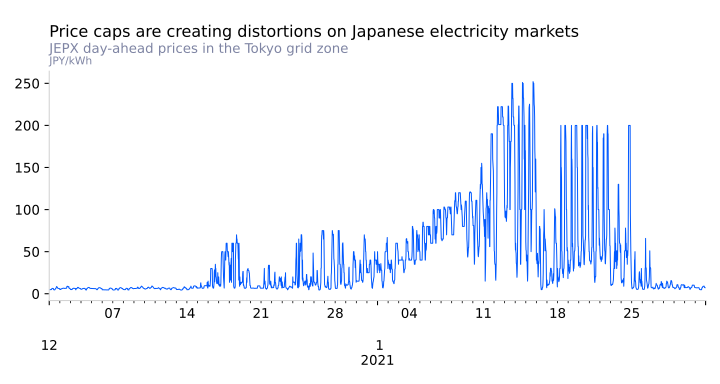
During the price spike in the winter of 2020-2021, prices repeatedly went over 250 JPY/kWh and later hit the price cap of 180 JPY/kWh, distorting the market.
Recent developments
All the structural factors described above contributed to a fragile power system, with weaknesses that have become painfully apparent due to recent developments. Two major factors contributed to precipitate the crisis we are witnessing now: rising prices of energy commodities and unplanned outages caused by an earthquake in March 2022.
LNG and coal prices started to increase in 2021 due to the world economic rebound from the Covid-19 pandemic. This situation was worsened by the Russian invasion of Ukraine in February 2022, which pushed prices of LNG to record levels and sparked a supply shortage as Europe scrambled to increase imports of LNG to replace Russian gas. Japan is particularly vulnerable to this development with 30% of its electricity being generated by LNG, making it the largest LNG importer in 2020 (surpassed by China in 2021).
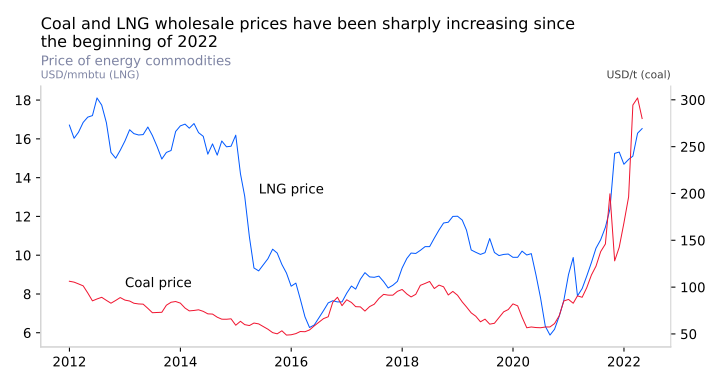
The price of LNG delivered to Japan has more than doubled in 2022 compared to the low of 2020, reaching its highest level since 2014. Coal prices have tripled compared to the average in the previous 10 years. Japan relies on imported coal for over 20% of its total electricity generation.
The second major contributing factor was a large earthquake off the coast of Fukushima in March 2022. As in 2011, the earthquake caused many power plants in Eastern Japan to be damaged or go offline, further excarbating the local supply crunch and driving down reserve capacity as the summer peak demand approached.
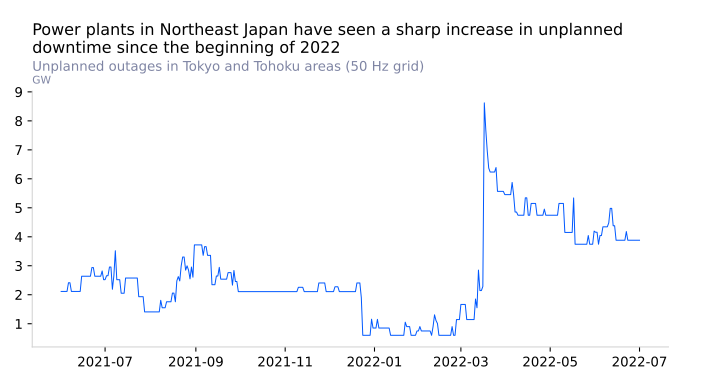
Peak demand in June in Tokyo was much higher than in the previous years, but it is comparable to peak daily demand during the usually hotter months of July and August.
What’s next
The data suggests that one possible pathway out of the current crisis is continued high investment in renewable generation, energy storage, and transmission capacity, far beyond Japan government targets and current volumes, especially with Japan’s nuclear fleet hanging in limbo between permanent retirement and public safety concerns.